
2.1 Sensitivity maps#
Part 2’s running model is the Budyko–Sellers energy balance model [Budyko, 1969, Sellers, 1969]: the Chapter 1.3 model extended over latitude. Zonal-mean surface temperature \(T(x, t)\) evolves on an equal-area grid in \(x = \sin(\mathrm{latitude})\) according to
Three ingredients are new. Insolation varies with latitude through the shape function \(s(x)\); outgoing longwave radiation is linearized about 0 °C, with \(A\) and \(B\) from Budyko’s fits to observations; and heat moves poleward by diffusion with coefficient \(D\) — a deliberately crude stand-in for everything the atmosphere and ocean do to carry energy toward the poles. The temperature-dependent albedo now creates an ice line: latitudes colder than −10 °C brighten. The model is non-chaotic (perturbations decay), so every gradient in Part 2 is well behaved even through long integrations — by construction, not by luck.
This chapter builds the model and asks its first science question: to which local perturbations is the Arctic most sensitive? One reverse-mode pass returns the answer at every latitude simultaneously — an adjoint sensitivity map.
Learning goals
Implement the Budyko–Sellers model in JAX as a step function plus
lax.scanValidate its climatology against the observed ice edge and equator-pole contrast
Compute an adjoint sensitivity map — one diagnostic, all inputs — in a single pass
Reproduce the map with
vmap-ed finite differences, and compare cost and accuracy
import jax
import jax.numpy as jnp
import matplotlib.pyplot as plt

jax.config.update("jax_enable_x64", True)   # climate work needs double precision
# Running on Colab? First run:  %pip install -q optax equinox diffrax
# --- The Budyko-Sellers model (defined in Chapter 2.1; repeated so this notebook is self-contained)
N_LAT = 60
x_edge = jnp.linspace(-1.0, 1.0, N_LAT + 1)      # cell edges in x = sin(latitude)
x = 0.5 * (x_edge[:-1] + x_edge[1:])             # cell centres (an equal-area grid)
dx = 2.0 / N_LAT
lat = jnp.rad2deg(jnp.arcsin(x))                 # centre latitudes (degrees)

Q = 340.25              # global-mean insolation S0/4, W m^-2
s_x = 1.0 - 0.482 * 0.5 * (3.0 * x**2 - 1.0)     # annual-mean insolation shape s(x)
A_olr = 203.3           # outgoing longwave radiation at 0 degC, W m^-2
B_olr = 2.09            # longwave feedback, W m^-2 K^-1
heat_capacity = 4.0e7   # J m^-2 K^-1 (~10 m of water)
dt = 21600.0            # 6-hour time step, s

default_params = {"D": 0.48, "albedo_warm": 0.32, "albedo_ice": 0.62}

def albedo(T, p):
    ice_fraction = 0.5 * (1.0 - jnp.tanh((T + 10.0) / 2.0))    # ice below about -10 degC
    return p["albedo_warm"] + (p["albedo_ice"] - p["albedo_warm"]) * ice_fraction

def energy_tendency(T, p, forcing=0.0):
    """Net energy input at each latitude (W m^-2), for temperature T in degC."""
    absorbed = Q * s_x * (1.0 - albedo(T, p))
    emitted = A_olr + B_olr * T
    flux = p["D"] * (1.0 - x_edge[1:-1] ** 2) * jnp.diff(T) / dx   # poleward heat flux
    flux = jnp.concatenate([jnp.zeros(1), flux, jnp.zeros(1)])     # no flux through the poles
    transport = jnp.diff(flux) / dx
    return absorbed - emitted + transport + forcing

def integrate(T0, p, forcing=0.0, n_years=30):
    """Step the model forward and return the final temperature profile."""
    n_steps = int(n_years * 365.25 * 86400 / dt)
    def step(T, _):
        return T + dt / heat_capacity * energy_tendency(T, p, forcing), None
    T_final, _ = jax.lax.scan(step, T0, None, length=n_steps)
    return T_final

T_start = 15.0 - 25.0 * 0.5 * (3.0 * x**2 - 1.0)    # smooth warm initial profile
A note on organization: every Part 2 chapter repeats this model-definition cell verbatim rather than importing it from a shared file, so that each notebook runs standalone (including on Colab, which downloads one notebook at a time). In a research project the model would live in a module.
The simulated climate#
Thirty years of spin-up reaches equilibrium (the model’s slowest adjustment timescale, set by \(C/B\), is under a year). The resulting climate is worth a hard look before any gradients — a sensitivity map of a bad climate is a bad sensitivity map:
T_eq = jax.jit(integrate, static_argnames="n_years")(T_start, default_params)

ice = T_eq < -10.0
ice_edge = float(jnp.min(jnp.abs(lat[ice])))
print(f"global-mean temperature: {float(jnp.mean(T_eq)):5.1f} degC   (observed ~14)")
print(f"equator temperature:     {float(T_eq[N_LAT//2]):5.1f} degC   (observed ~26)")
print(f"polar temperature:       {float(T_eq[-1]):5.1f} degC")
print(f"ice edge at |latitude| = {ice_edge:.0f} deg    (observed ~72)")

plt.plot(lat, T_eq, lw=2)
plt.axhline(-10, color="steelblue", ls=":", label="ice threshold (-10 degC)")
plt.fill_between(lat, -35, 30, where=ice, alpha=0.15, color="steelblue", label="ice-covered")
plt.xlabel("latitude (deg)"); plt.ylabel("temperature (degC)")
plt.legend(); plt.title("Equilibrium climate of the Budyko-Sellers model")
plt.show()
global-mean temperature:  11.2 degC   (observed ~14)
equator temperature:      23.9 degC   (observed ~26)
polar temperature:       -16.5 degC
ice edge at |latitude| = 72 deg    (observed ~72)
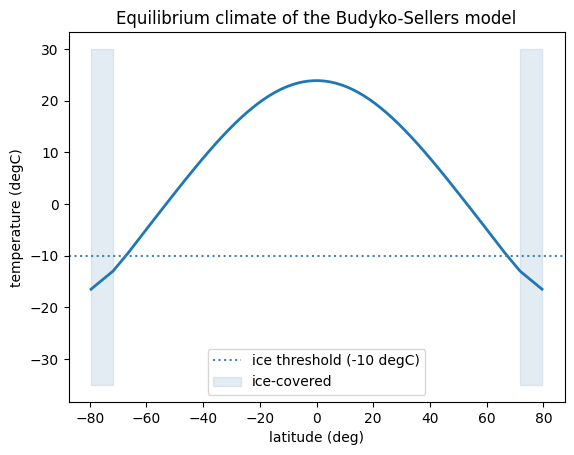
The mean over x is already an area-weighted global mean — that is why the model
uses the \(\sin(\mathrm{latitude})\) grid. The climate is structurally right (a slightly
cool global mean, a realistic equator–pole contrast of about 40 K, polar ice caps
reaching to 72°), which is as much as a two-parameter-albedo annual-mean model should
claim.
One adjoint pass, one map#
The science question: if a 1 W m⁻² heating were applied at a single latitude — by an aerosol change, a cloud feedback, a sea-ice anomaly — how much would the Arctic warm? Define the diagnostic (area-mean temperature poleward of 60° N) as a function of a per-latitude forcing field, and take its gradient. Because the diagnostic is one number and the forcing has 60 components, this is exactly the case reverse mode prices at a single pass:
arctic = jnp.where(x > jnp.sin(jnp.deg2rad(60.0)), 1.0, 0.0)

def arctic_mean_T(forcing):
    T = integrate(T_start, default_params, forcing)
    return jnp.sum(T * arctic) / jnp.sum(arctic)

sensitivity_map = jax.jit(jax.grad(arctic_mean_T))(jnp.zeros(N_LAT))

plt.plot(lat, sensitivity_map, lw=2)
plt.axvspan(60, 90, alpha=0.15, color="firebrick", label="diagnostic region")
plt.xlabel("latitude of applied forcing (deg)")
plt.ylabel("Arctic warming per unit forcing\n(K per W m$^{-2}$)")
plt.legend(); plt.title("Adjoint sensitivity of Arctic temperature")
plt.show()
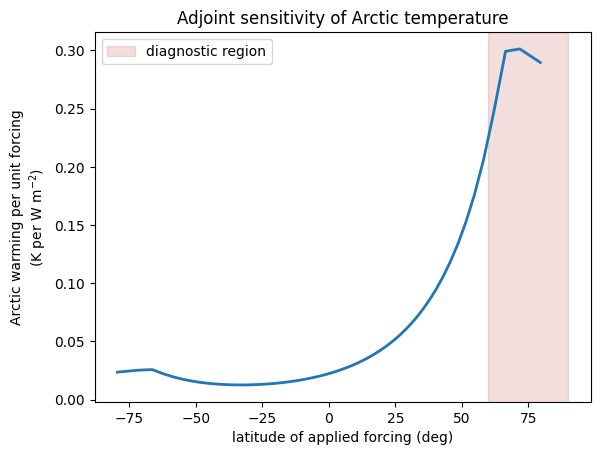
Reading the map as science: forcing applied inside the Arctic is most effective
(about 0.3 K per W m⁻², amplified by the ice–albedo feedback as warming darkens the
surface), but the sensitivity is nowhere zero — heating at 45° N still warms the Arctic
at roughly a third of that rate, delivered by the diffusive transport, and even
tropical and Southern-Hemisphere forcing leaks through. The equivalent information from
forward calculations would require one perturbed model run per latitude. This is the
workflow of classical adjoint sensitivity studies [Errico, 1997] — with the
adjoint generated by jax.grad instead of years of hand coding.
The brute-force check#
Skepticism is warranted for any quantity produced by one pass of anything. The
finite-difference version of the map perturbs one latitude at a time — 60 pairs of
model runs, batched by vmap into a single vectorized computation:
import time

@jax.jit
def fd_sensitivity(i, h=0.01):
    bump = jnp.zeros(N_LAT).at[i].set(h)
    return (arctic_mean_T(bump) - arctic_mean_T(-bump)) / (2 * h)

grad_fn = jax.jit(jax.grad(arctic_mean_T))
grad_fn(jnp.zeros(N_LAT)).block_until_ready()          # compile before timing
t = time.perf_counter()
adjoint_map = grad_fn(jnp.zeros(N_LAT)).block_until_ready()
t_adj = time.perf_counter() - t

fd_map = jax.vmap(fd_sensitivity)(jnp.arange(N_LAT))   # compile
t = time.perf_counter()
fd_map = jax.vmap(fd_sensitivity)(jnp.arange(N_LAT)).block_until_ready()
t_fd = time.perf_counter() - t

print(f"adjoint map:          {t_adj:6.3f} s  (one reverse pass)")
print(f"finite differences:   {t_fd:6.3f} s  (120 model runs)")
print(f"largest disagreement: {float(jnp.max(jnp.abs(adjoint_map - fd_map))):.2e} K per W m^-2")
adjoint map:           0.035 s  (one reverse pass)
finite differences:    4.452 s  (120 model runs)
largest disagreement: 4.18e-07 K per W m^-2
The two maps agree to about seven decimal digits; the small residual is the finite difference’s own truncation error, not the adjoint’s. The cost ratio — two orders of magnitude on this small problem — is set by the number of inputs — for a model with a million-component forcing field it would be roughly a million to one, which is why adjoint maps changed what counts as an askable question.
Exercises.
Compute the sensitivity of the ice-edge latitude to forcing at every latitude. (Hint: a differentiable proxy for the ice edge is the area-mean of
jax.nn.sigmoid((-10 - T) / 2), the ice-covered fraction.)Map the sensitivity of global-mean temperature to forcing. Why is it nearly flat at low latitudes, and what does its polar structure say about feedbacks?
Rebuild the map with the diagnostic poleward of 80° N. Does the mid-latitude contribution shrink or grow? Explain via the transport term.